The opportunity dashboard gives you a quick overview of all recorded opportunities and shows you where action is currently needed.
Overview
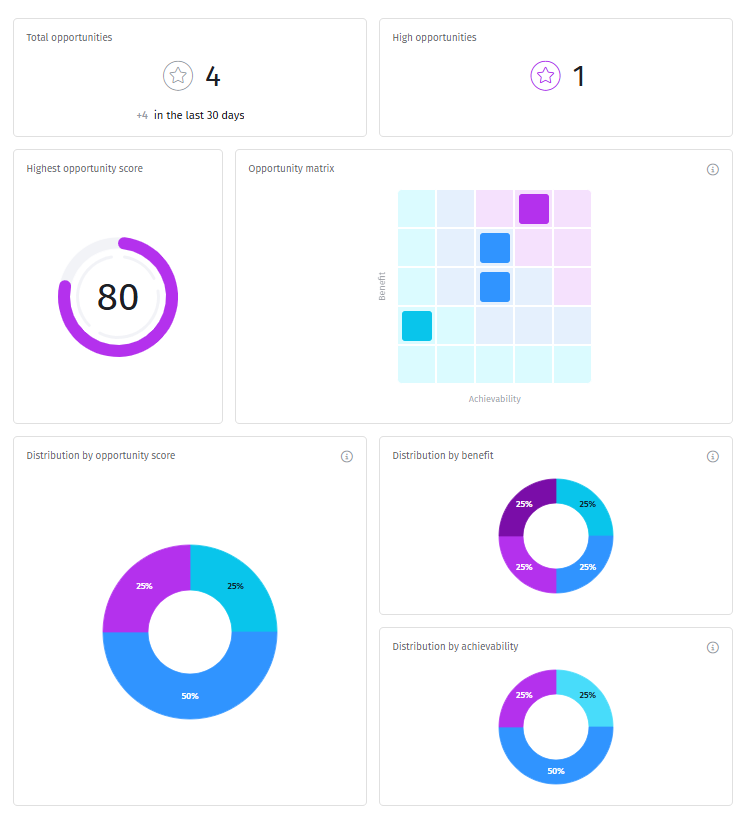
The opportunity dashboard brings together the key figures for your opportunities:
- Total opportunities and High opportunities show how many opportunities exist in total and how many are classified as high.
- Highest opportunity score shows the currently recorded opportunity score with the highest potential.
- The opportunity matrix arranges all opportunities by benefit and achievability, so you can see at a glance where opportunities cluster.
- Distribution by opportunity score, distribution by benefit, and distribution by achievability each show, as a chart, how opportunities are distributed percentage-wise across the different opportunity levels.
Operational control
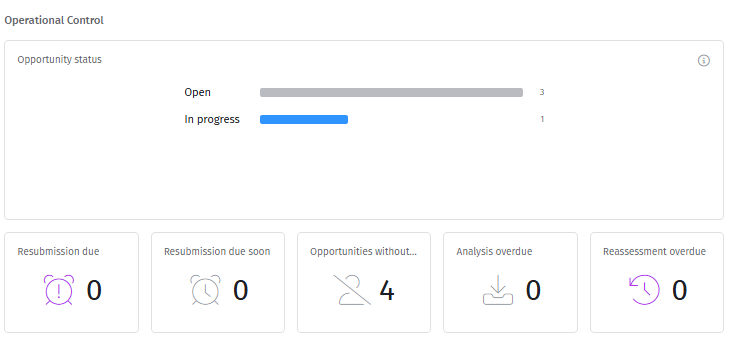
The Operational control area is identical to the risk dashboard and supports you in the ongoing handling of your opportunities:
- Opportunity status shows how many opportunities are currently in each status.
- The tiles below flag where action is needed:
- Resubmission due and Resubmission due soon show upcoming deadlines.
- Opportunities without owners points to missing ownership.
- Analysis overdue and Reassessment overdue highlight where a (re)assessment is due.
Good to know: All charts in the dashboard are clickable and take you straight to the matching view.
Related articles
Was this article helpful?
That’s Great!
Thank you for your feedback
Sorry! We couldn't be helpful
Thank you for your feedback
Feedback sent
We appreciate your effort and will try to fix the article