Every risk is assessed based on extent of damage and probability of occurrence. The risk value is calculated automatically from these two values. This article explains risk statuses, how the assessment works, and how you can track the risk value history.
Risk status
A risk can be in different statuses. Colors indicate the status categories.
| Status | Meaning |
|---|---|
| Open | The risk has been recorded but not yet worked on. |
| Analysis | The risk is currently being assessed and investigated. |
| In progress | Measures to address the risk are being implemented. |
| Paused | Work on the risk is temporarily paused. |
| Review pending | The risk is waiting for a final review or approval. |
| Reassessment | The risk is being reassessed, for example after changes. |
| Accepted | The risk has been deliberately classified as acceptable and is tolerated. |
| Minimized | The risk has been reduced to an acceptable level through measures. |
| Transferred | The risk has been passed on to a third party, for example through insurance. |
| Avoided | The activity or cause behind the risk has been eliminated entirely. |
| Discarded | The risk has been classified as not relevant and is no longer pursued. |
Risk assessment
You assess a risk using the sliders for extent of damage and probability of occurrence. Both can be set anywhere between "low" and "high". The risk value is calculated automatically from the combination of both values.
Whenever you change the risk status, the current assessment is logged and recorded in the risk value history.
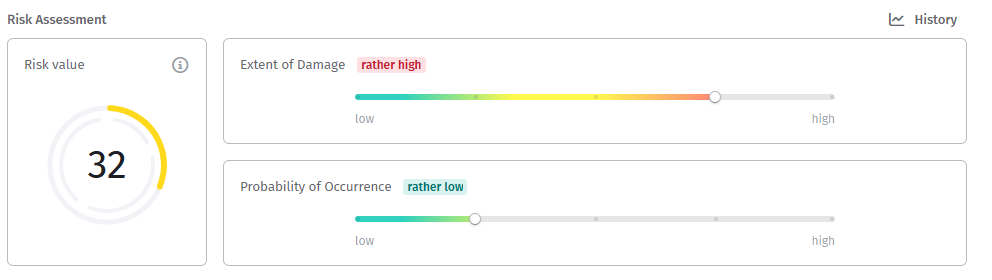
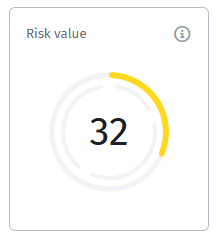
Risk value
The risk value is the product of extent of damage and probability of occurrence. The result is normalized to 100.
Normalizing to 100 ensures the risk value always falls within the same range, regardless of the assessment scales you've chosen. This keeps all risks comparable, so you can sort and filter them by criticality. A value between 0 and 100 is also easy to interpret intuitively, similar to a percentage.
The risk value helps you classify the level of risk, for example as "Low risk", "Medium risk", or "High risk".
Risk value history
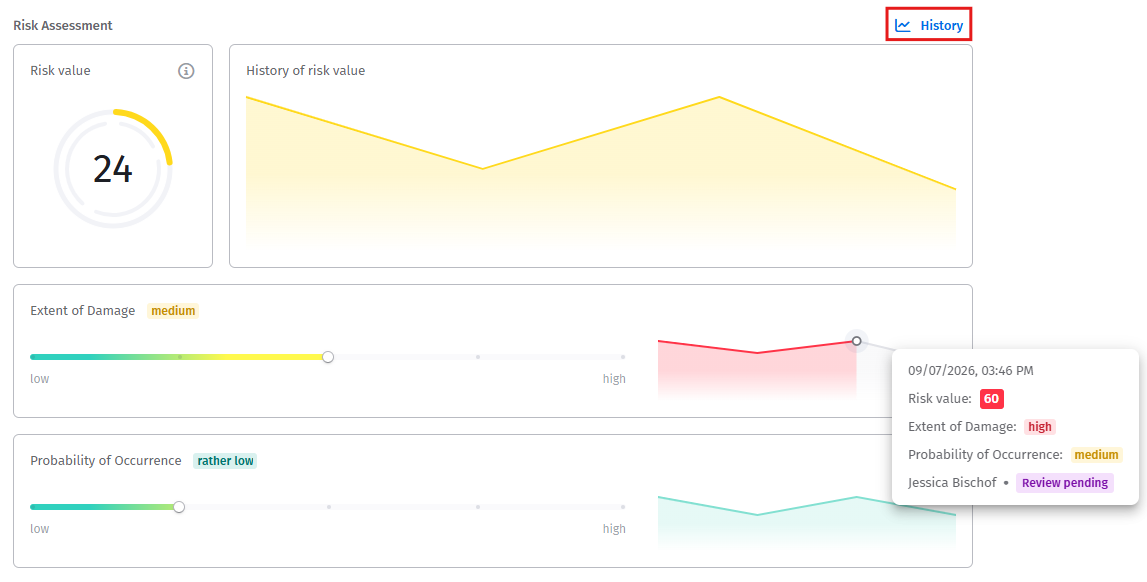
Use the History button to show or hide the history of the values. The history lets you see how extent of damage, probability of occurrence, and risk value have developed over time.
Hovering over the chart shows further details for the selected point in time:
- Date and time
- Risk value
- Extent of damage
- Probability of occurrence
- The person who set the status
- The risk status at that point in time
Related articles
Was this article helpful?
That’s Great!
Thank you for your feedback
Sorry! We couldn't be helpful
Thank you for your feedback
Feedback sent
We appreciate your effort and will try to fix the article